Facts and Figures
Performance Measurement Reporting System (PMRS)
According to the DHE, the PMRS "provides a comprehensive examination of the performance of each of Massachusetts’ community colleges and state universities on a set of key indicators focused on Access & Affordability, Student Success & Completion, Workforce Alignment and Fiscal Stewardship."
PMRS Data Report for Massachusetts Maritime Academy
Common Data Sets (CDS)
The Common Data Set is a set of standard data items that form the basis of reports to external survey organizations, including the College Board, Peterson's, and U.S. News & World Report.
Factbook
Massachusetts Maritime Academy's Factbook (previously titled Key Data Elements & Indicators Report) is an annual report that was initiated in the 2015-2016 academic year. It includes a snapshot overview as well as detailed data pertaining to admissions, enrollment, and degrees. The report also includes information on educational effectiveness indicators, including retention and graduation rates as well as other measures of student achievement and success.
- 2025-2026 Full Report
- 2024-2025 Full Report
- 2023-2024 Full Report
- 2022-2023 Full Report
- 2021-2022 Full Report
Student Consumer Information
The Higher Education Act of 1965 (HEA), as amended by the Higher Education Opportunity Act (HEOA) of 2008, requires that institutions that participate in Title IV student financial aid programs disclose disaggregated graduation rates by gender, race/ethnicity, and receipt of federal aid. Additional disclosure information is available in Massachusetts Maritime Academy's Factbook (see above) and through Massachusetts Maritime Academy's Student Consumer Information web page.
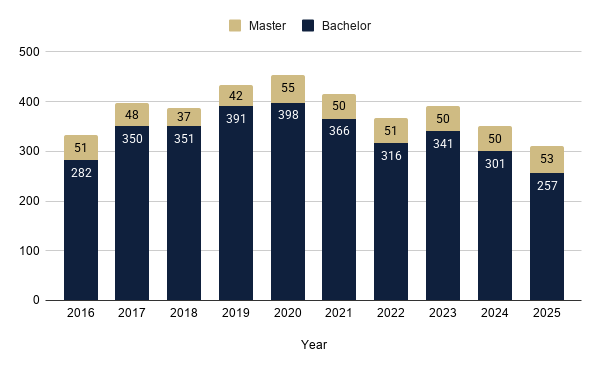
Degrees Conferred
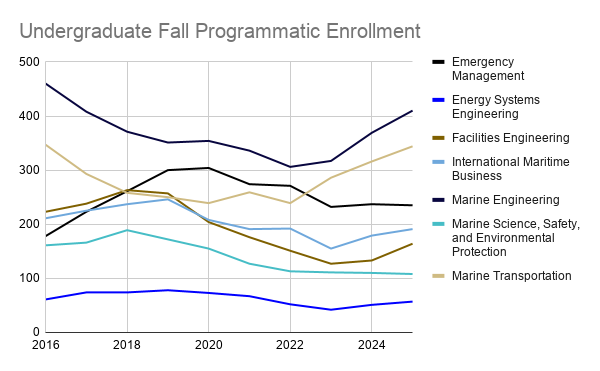
Fall Enrollment
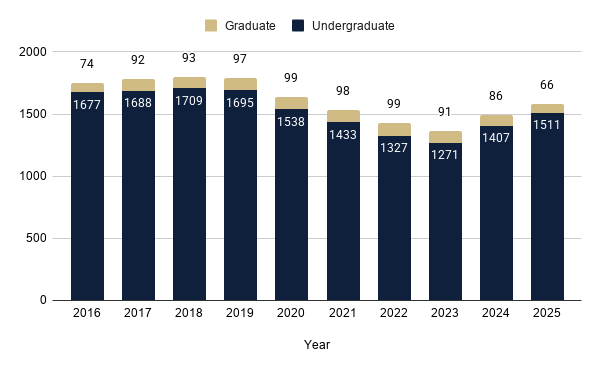
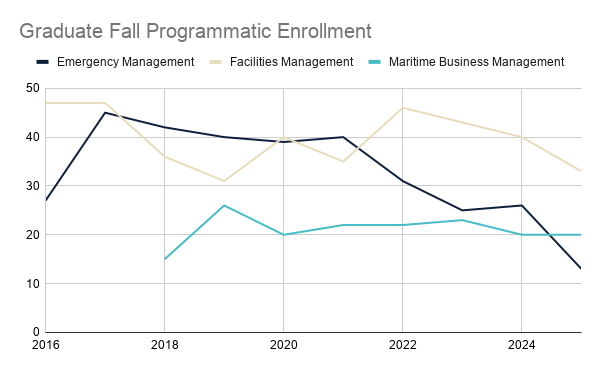
*Due to the federal government shutdown in November 2025, graduate enrollment numbers slightly declined during this time as a result of the impact on federal employer tuition reimbursement.
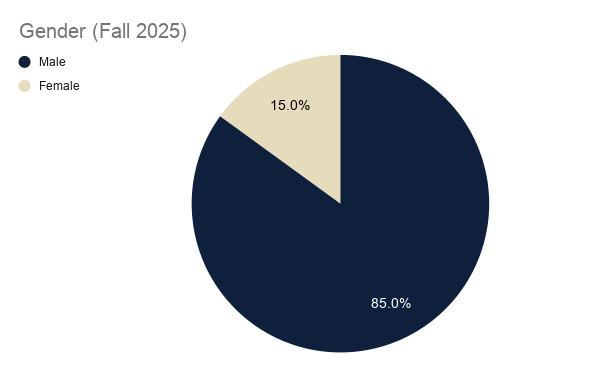
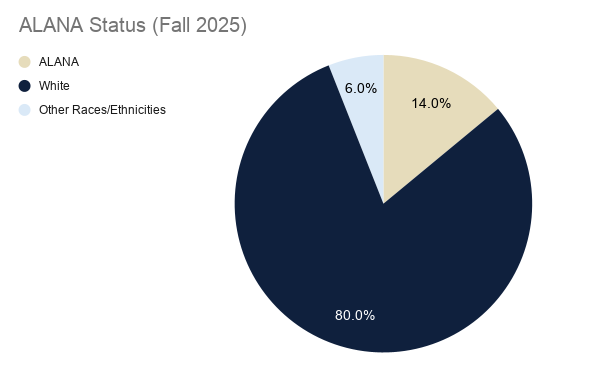
Full-Time Undergraduate Demographics
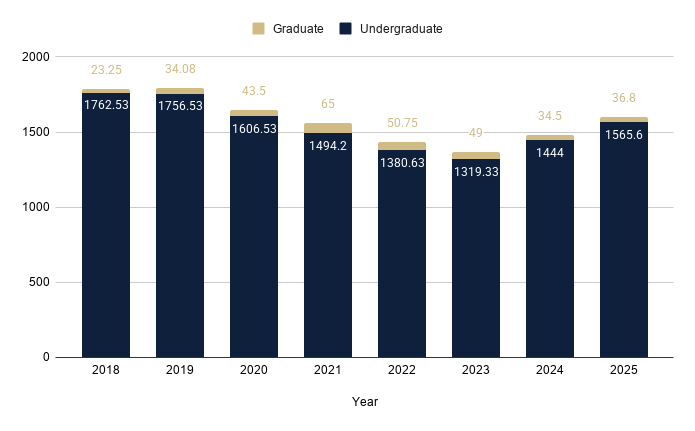
FTE Enrollment Trends
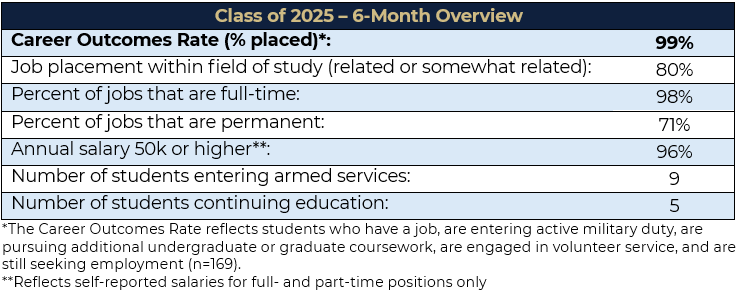
Career Outcomes (Class of 2025)