
Ahoy, Followers –
I am always looking for mathematics aboard the TS Kennedy. Yesterday, I struck it rich! My discovery incorporated both mathematics and science.
Cadets introduced me to a barograph.
Now, I know what you’re thinking. “Little Buc, you’ve made a mistake. It’s a bar graph, not a barograph.”
No mistakes here! Let me explain!
We all know that a bar graph is a picture made of bars of different heights. They are used to compare and contrast different types of data. A bar’s height tells us how often something happens or shows us the number of items in a category.
Here are two bar graphs.


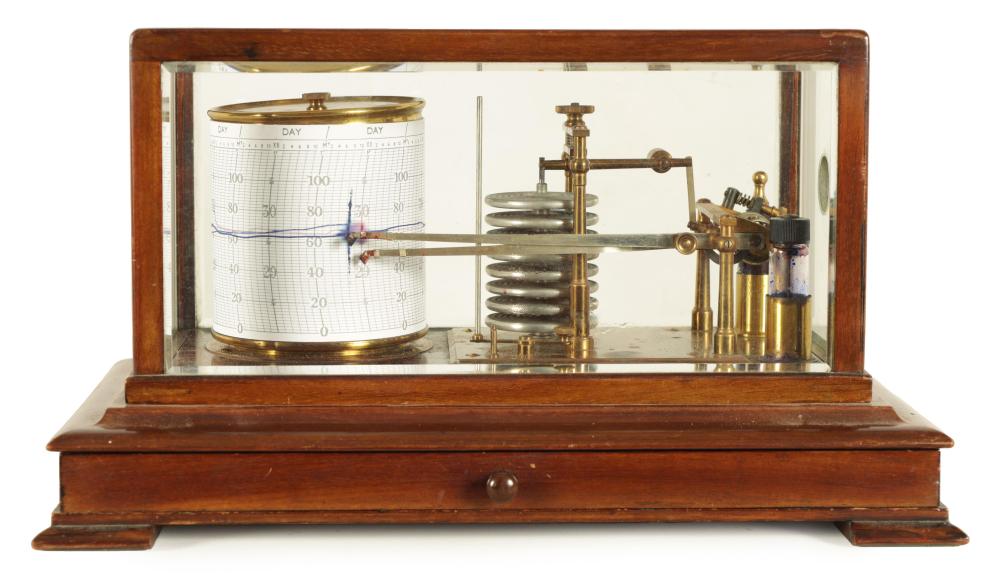
But, I am NOT talking about a bar graph. What I saw on the Bridge yesterday was a barograph. Here are two photos of my discovery.
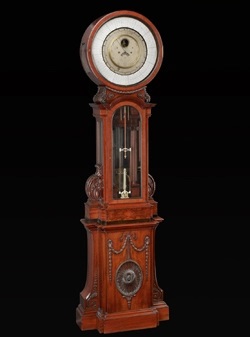
A barograph is a type of weather instrument. It continuously records atmospheric pressure and barometric pressure in the form of a graph. When the pressure changes, an arm on the barograph moves, marking a line on chart paper. Studying pressure changes can help crew members forecast the weather. Electronic weather instruments that use computer programs have replaced barographs on modern ships.
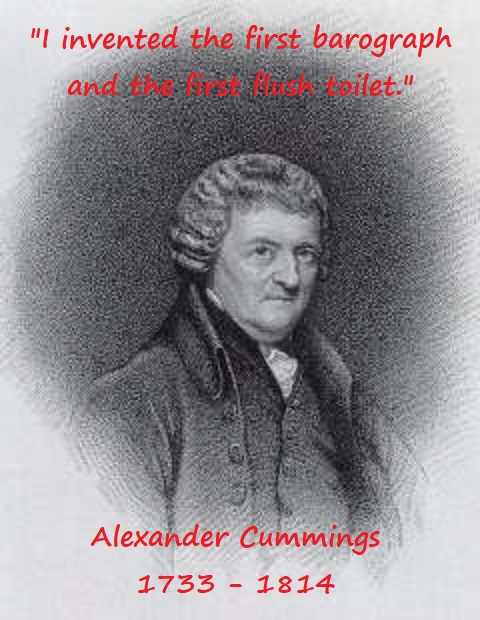
Are you wondering who invented the barograph? In 1765, Alexander Cummings, a watchmaker from Scotland, invented a clock for King George III. The clock also acted as a barometer, recording air pressure over time. This is considered first recording barograph. His barograph may not have earned Alexander a lot of attention, but everyone knows about his previous invention. One year earlier, in 1775, Alexander was granted the first patent for a flush toilet.
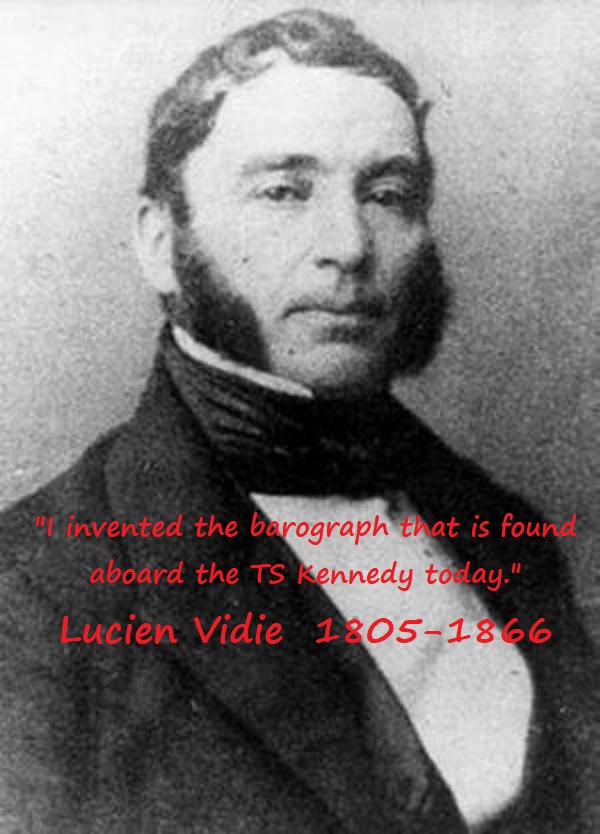
In 1844, a French physicist name Lucien Vidie is credited with inventing a barograph that resembles the barograph that I found on the TS Kennedy.
Today, tell everyone you meet, “Little Buc found a barograph aboard the TS Kennedy.” and then see what they have to say!
Your favorite mathematics-loving pirate,
Little Buc